\(\chi^2\) is a test statistic for hypothesis testing.
motivation for chi-square
The motivation for chi-square is because t-test (means, “is the value significantly different”) and z-test (proportion, “is the incidence percentage significantly different”) all don’t really cover categorical data samples: “the categories are distributed in this way.”
Take, for instance, if we want to test the following null hypothesis:
| Category | Expected | Actual |
|---|---|---|
| A | 25 | 20 |
| B | 25 | 20 |
| C | 25 | 25 |
| D | 25 | 25 |
\(\alpha = 0.05\). What do we use to test this??
(hint: we can’t, unless…)
Enter chi-square.
chi-square test
chi-square test is a hypothesis test for categorical data. It is responsible to translate differences in distributions into p-values for significance.
Begin by calculating chi-square after you confirmed that your experiment meets conditions for inference (chi-square test).
Once you have that, look it up at a chi-square table to figure the appropriate p-value. Then, proceed with normal hypothesis testing.
Because of this categorical nature, chi-square test can also be used as a homogeneity test.
conditions for inference (chi-square test)
- random sampling
- expected value for data must be \(\geq 5\)
- sampling should be \(<10\%\) or independent
chi-square test for homogeneity
The chi-square test for homogeneity is a test for homogeneity via the chi-square statistic.
To do this, we take the probability of a certain outcome happening—if distributed equally—and apply it to the samples to compare.
Take, for instance:
| Subject | Right Hand | Left Hand | Total |
|---|---|---|---|
| STEM | 30 | 10 | 40 |
| Humanities | 15 | 25 | 40 |
| Equal | 15 | 5 | 20 |
| Total | 60 | 40 | 100 |
We will then figure the expected outcomes:
| Right | Left |
|---|---|
| 24 | 16 |
| 24 | 16 |
| 12 | 8 |
Awesome! Now, calculate chi-square with each cell of measured outcomes. Calculate degrees of freedom by (num_row-1)*(num_col-1).
chi-square test for independence
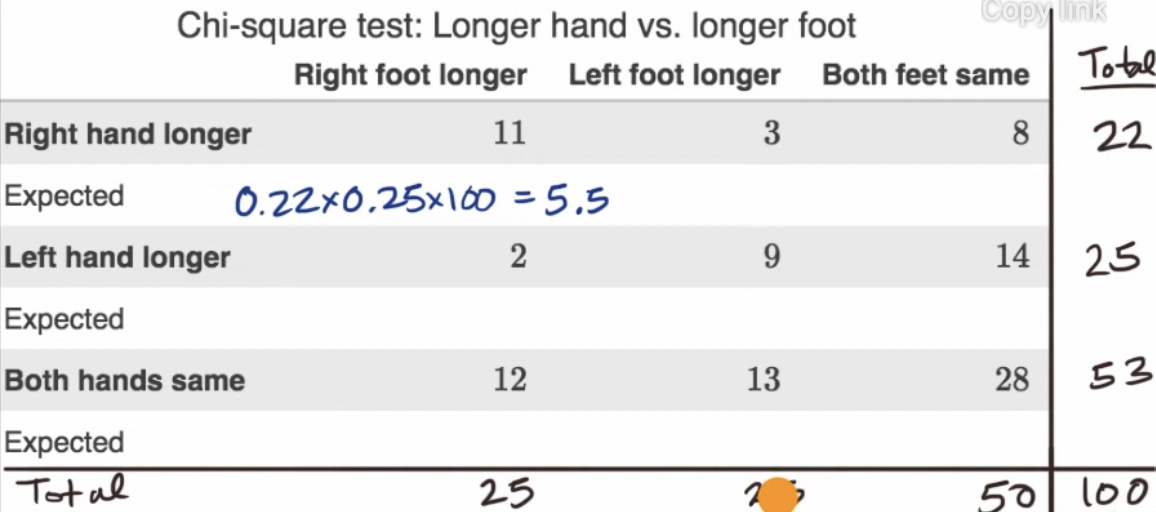
The chi-square test for independence is a test designed to accept-reject the null hypothesis of “no association between two variables.”
Essentially, you leverage the fact that “AND” relationships are multiplicative probabilities. Therefore, the expected outcomes are simply the multiplied/fraction of sums:

calculating chi-square
\begin{equation} \chi^2 = \frac{(\hat{x}_0-x_0)^2}{x_0} +\frac{(\hat{x}_1-x_1)^2}{x_1} + \cdots + \frac{(\hat{x}_n-x_n)^2}{x_n} \end{equation}
Where, \(\hat{x}_i\) is the measured value and \(x_i\) is the expected value.