We want to compare features of the model to features of the data:
Visual diagnostics
- PDF plot
- CDF of data vs. CDF of model
- Quantile-Quantile plot
- Calibration Plot
Summative Metrics
- KL Divergence
- Expected Calibration Error
- Maximum Calibration Error
Marginalization Ignores Covariances
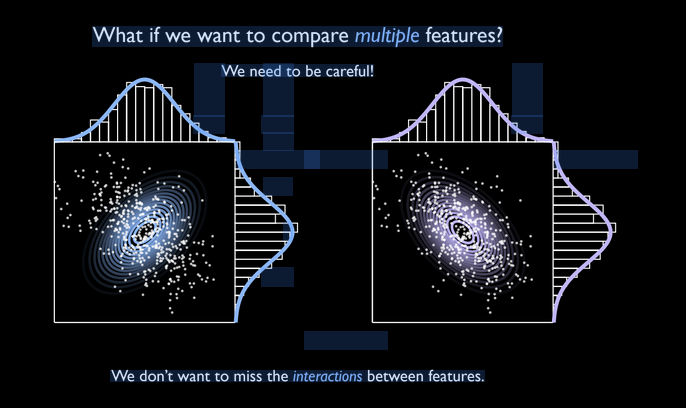
Notice on the figure on the right captures distribution much better, yet the marginal distributions don’t show this. This is because marginalizing over the datasets ignores the covariances. Hence, remember to keep dimensions and any projections hould capture covariances, etc.
Conditional Distributions
Bin the conditions into groups and perform evals on each.
Turing Test
If expert knowledge is available, you can show an expect roll outs from data and model, and see if they can tell.